
How to build a timeline, step by step
This guide takes you from a blank page to a timeline that is printed, exported or shared with your students, using Otoolia’s Timeline Creator. Allow ten minutes for a first timeline. No account is needed and your data stays in your browser.
1Get started in two minutes
Open the Timeline Creator: the page shows a toolbar, a settings column on the left and the timeline preview on the right. To see what the tool can do right away, click Load an example: ten events, four coloured periods, durations and chronology breaks.
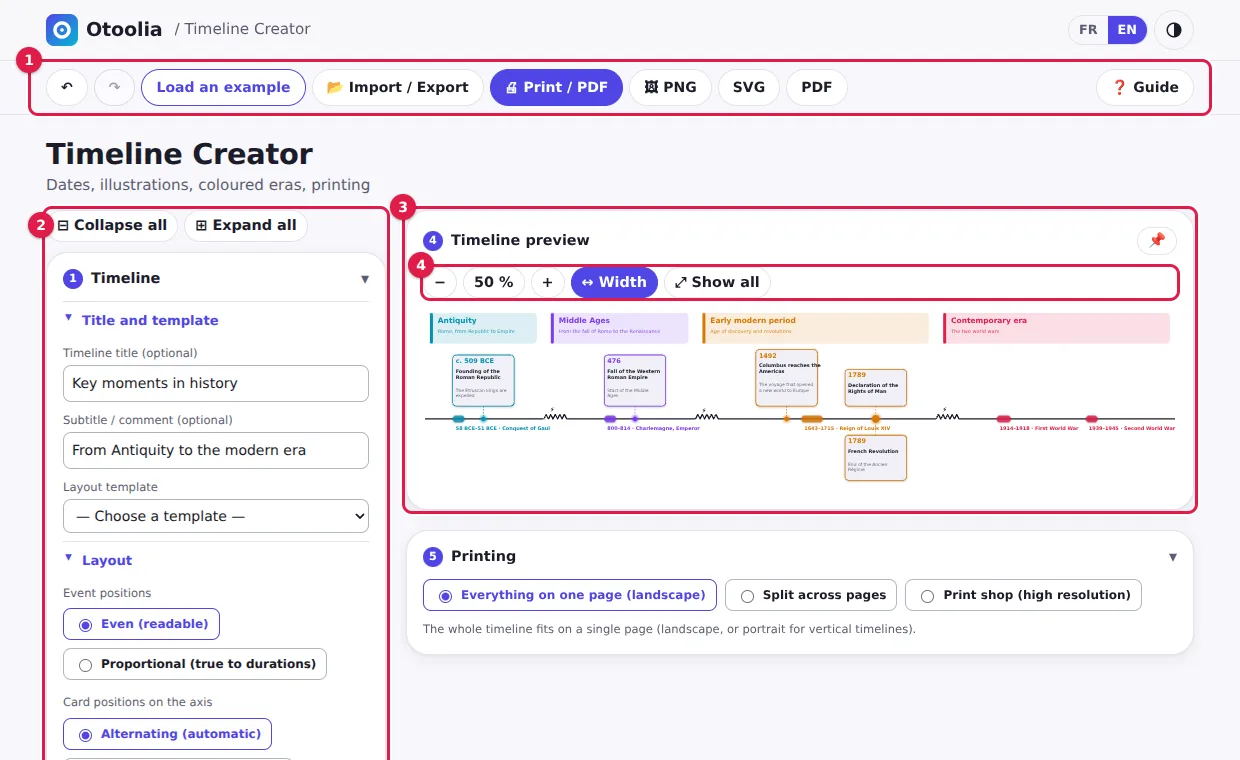
- Toolbar: undo and redo, load an example, import / export, print, PNG, SVG, PDF.
- Settings column: the “Timeline”, “Add an event” and “Events” cards. Every card and sub-menu can be collapsed; Collapse all and Expand all act on everything at once.
- Preview: the timeline is redrawn after every change.
- Zoom: −, +, ↔ Width and ⤢ Show all.
A timeline is always built in the same order:
- give it a title and pick a template;
- add your events, with their dates;
- group them into coloured periods;
- add pictures if you like;
- set the layout and the appearance;
- optional: turn it into an exercise;
- print, export or share the result.
Your work is saved automatically in the browser of the device you are using: you can close the page and come back later. To keep it elsewhere or send it to someone, use the .json export (see Print, export, share).
2Set a title and pick a template
In the Timeline card, the Title and template sub-menu holds the timeline’s title and subtitle. Both are optional; when filled in, they appear above the timeline, in print and in exports.
The layout template sets several options at once; you can then adjust everything by hand.
- Classic: simple line, markers sized by the number of events.
- Textbook: line with arrowhead, identical markers, coloured date backgrounds.
- Minimal: muted colours, no lightning bolt on breaks.
- To scale: proportional spacing, arrow and graduated scale.
- High contrast: arrow, dates on a dark background and strongly contrasting colours.
- Exercise to complete: turns on exercise mode.
A template replaces the settings it covers and, for some of them, the colour of the periods. Pick it first; your own settings come afterwards.
3Add events
The Add an event card is the heart of the tool. Fill it in, then click Add to the timeline: the event immediately appears in the preview and in the “Events” list.
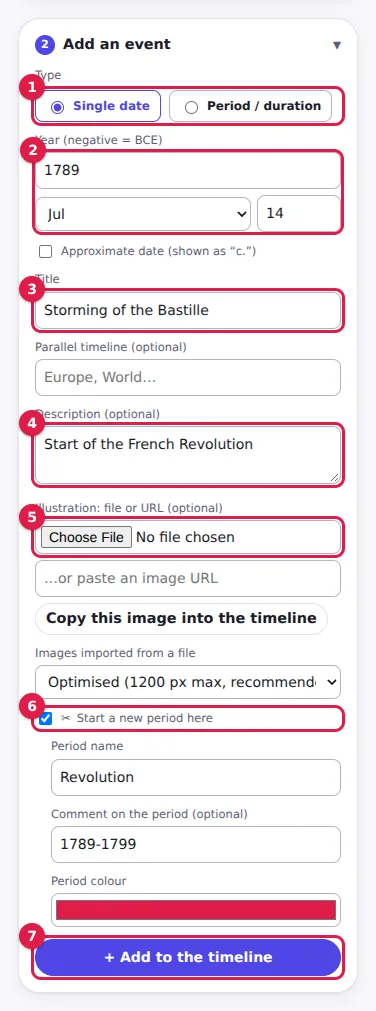
- Type: “Single date” or “Period / duration” (a duration also shows an end year).
- Date: the year is enough. A negative number means a year BCE (−509 is shown as “509 BCE”). Month and day are optional. The “Approximate date” box displays “c.”.
- Title of the event.
- Description, optional: a line of context under the title.
- Illustration: a file or an image address (see Add pictures).
- Start a new period here: see Group events into periods.
- Add to the timeline.
A few useful details:
- A period or duration (for example Louis XIV’s reign, 1643–1715) is drawn as a bar along the axis, with a label such as “1643–1715 · Reign of Louis XIV”.
- Several events on the same date? No problem: their boxes stack up and each one shows its date.
- Parallel timelines: the “Parallel timeline (optional)” field lets you stack several timelines on a common scale (“Europe”, “World”…). Give the same name to all the events of one line. The display is then horizontal.
- Edit or delete: click an event in the “Events” card. A deletion can be undone with Ctrl+Z.
Import many events at once (CSV)
In the Import / Export window, the Quick import (CSV) area accepts pasted text or a file. One line per event: year ; title ; description (optional) ; image address (optional) ; period (optional). Separators can be a semicolon, a comma or a tab.
Year ; Title ; Description
!-509 ; Antiquity ; From the Republic to the Empire
-509 ; Founding of the Roman Republic ; The Etruscan kings are expelled
476 ; Fall of the Western Roman Empire
!800 ; Middle Ages ; A thousand years of history
800-814 ; Reign of Charlemagne ; Emperor of the West
14/07/1789 ; Storming of the Bastille ; Start of the Revolution- A duration is written
year1-year2; a full date isdd/mm/yyyyoryyyy-mm-dd. - A line starting with
!is not an event: it opens a new period (name, then comment) for the event that follows it. - Header lines, like the first one above, are ignored.
4Group events into periods
To split the timeline into eras, tick Start a new period here on the first event of each period, then give it a name, an optional comment and a colour. A period lasts until the event that starts the next one.
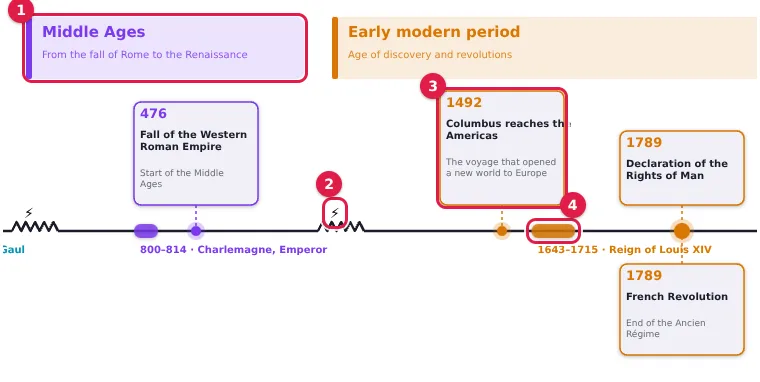
- Period band: name and comment, in the colour of the period.
- Chronology break: the axis is cut between two periods (with a lightning bolt, if the option is ticked) to show that the spacing must not be read as a duration.
- Event box: date, title and description, in the colour of the period.
- Duration: a bar on the axis and its label.
To change a period’s name or colour, edit the event that starts it: click it in the “Events” list.
5Add pictures
- From a file: choose the image in the form. The “Images imported from a file” menu sets its size: Optimised (1200 px at most, recommended), Light (800 px) or Original (maximum quality, heavier files).
- From an address: paste the image address, then click Copy this image into the timeline to save it with the timeline. Some sites forbid copying; the tool tells you so: save the image to your device (right-click › Save image) and import it as a file.
- Several images at once: in Import / Export, the “Assign images” section lets you pick all your images, then link each one to its event.
- Remove a picture: edit the event and tick “Remove the current illustration”.
A share link does not carry images imported from a file. For a full backup, or to send the timeline with its pictures, use the .json export.
6Choose the layout
In the Timeline card, the Layout sub-menu gathers the shape settings. Only those that matter for the chosen configuration are shown.
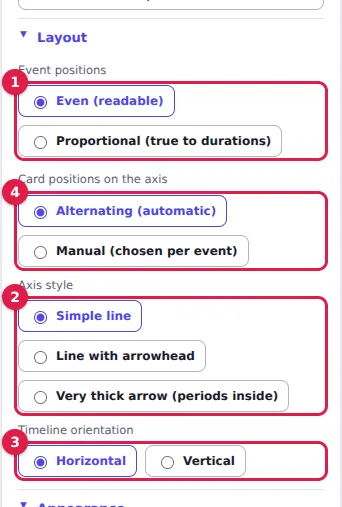
- Event positions: Even spaces events for readability; Proportional follows the real durations.
- Axis style: simple line, line with arrowhead or very thick arrow.
- Orientation: horizontal or vertical.
- Card positions on the axis: alternating (automatic) or manual.
Even or proportional?
In Even mode every event takes the same room: it is the most readable, but distance says nothing about elapsed time. In Proportional mode, spacing is true to durations: you see at once that Antiquity is long and the 20th century dense. Combine it with the Graduated scale option (“Appearance” sub-menu) to show date marks. When boxes get in each other’s way, they stack automatically.
The axis: line, arrow, very thick arrow
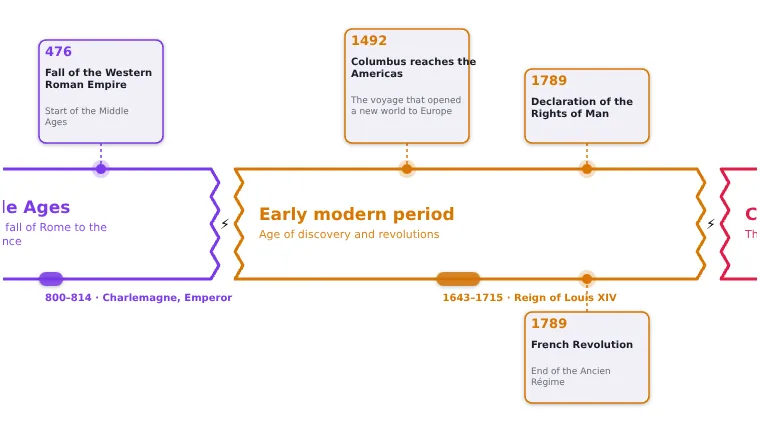
The very thick arrow (horizontal timeline) writes the periods inside the arrow. It is cut into pieces, one per period, with a straight or lightning-shaped cut. You set its thickness (from 40 to 200 px), can tint the inside by period, colour the outline in the period’s colour, or write the period names inside the arrow or above it.
The vertical timeline, straight or winding
With the Vertical orientation, you choose:
- the direction: downwards (oldest at the top) or upwards (oldest at the bottom);
- where the period names go (left or right) and the gap to the boxes;
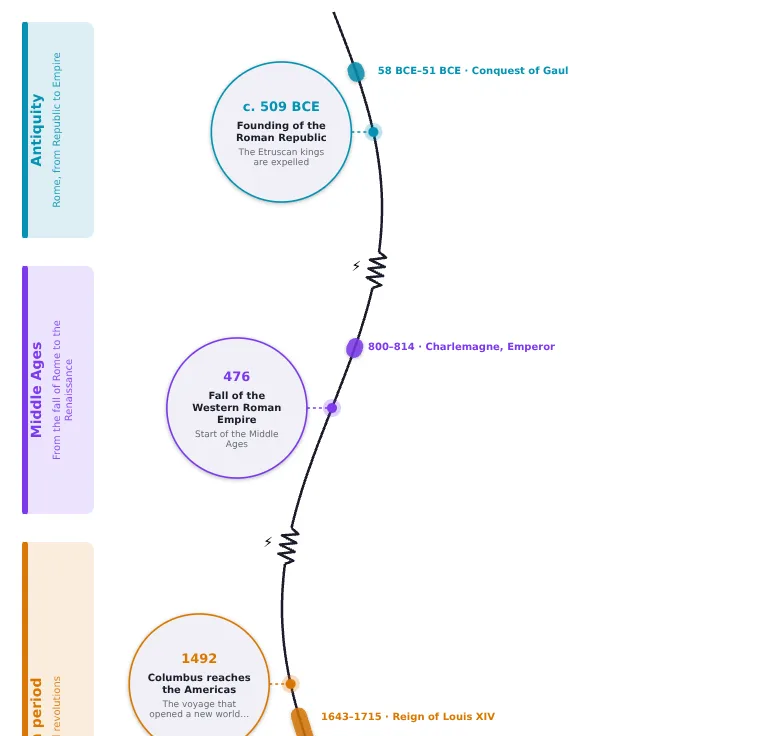
- the axis path: straight, or winding. A winding axis is set with the sideways swing and the height of one wave; boxes keep their distance from the curve and chronology breaks follow it;
- boxes as discs (winding axis), with a diameter from 100 to 240 px: the date, title, description and round picture are centred in the disc.
Move a box to the other side of the axis
In Alternating (automatic) mode, boxes sit on one side of the axis then the other. To change one, grab it in the preview and drop it on the other side (on a touch screen: long press, then drag). The tool then switches to manual positioning and keeps the other boxes where they are. You can also pick the side in the form, under “Position on the axis (manual mode)”.
7Fine-tune the appearance
The Appearance sub-menu of the “Timeline” card contains:
- Axis markers: their size follows the number of events, or they are all identical;
- Event colours: the colour of the period, or a custom colour for each event (a colour picker then appears in the form);
- Lightning bolt on chronology breaks: a bolt on the cut between two periods;
- Graduated scale: date marks along the axis;
- Coloured background behind dates: a coloured badge around each date.
9Make an exercise
The same timeline can serve first as a lesson, then as an exercise. In the Exercise mode sub-menu, tick “Exercise mode: hide texts”. Choose what to hide: everything, dates only or titles and descriptions only. Hidden texts give way to dotted lines to fill in, and a click on a box reveals it.
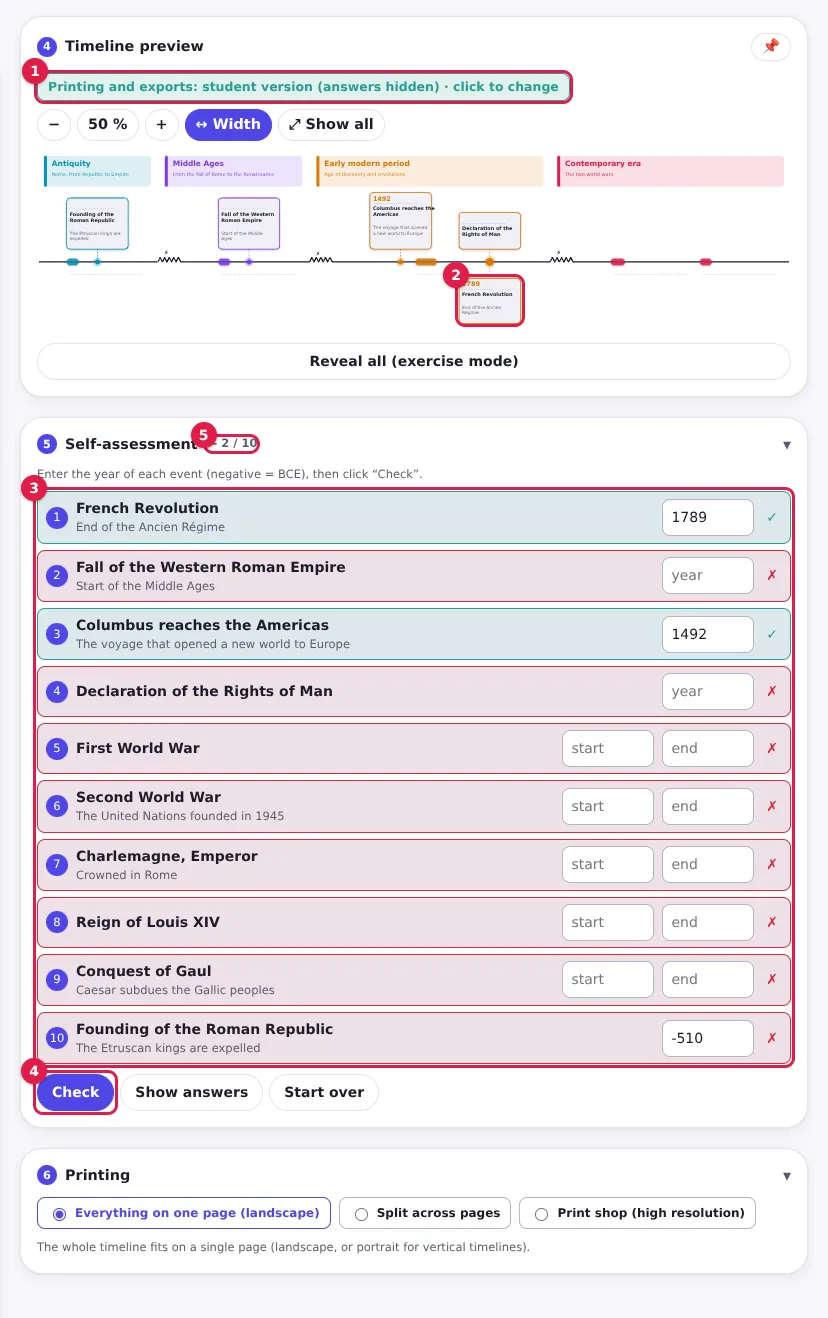
- Version badge: green for the student version (answers hidden), red for the answer key. A click toggles it.
- Hidden boxes: hidden dates are replaced by dotted lines.
- Self-assessment: the list of events, in random order. You type the year of each one (start and end for a period).
- Check: each answer is marked right or wrong; Show answers and Start over complete the panel.
- Score: the number of correct answers.
- Tolerance: the “Self-assessment tolerance” setting accepts an answer within ± 0, 5, 10 or 25 years.
- Student version or answer key: under “Printing and exports in exercise mode”, choose what comes out in print and in exports. Print the student version first, then the answer key.
- In class: give your students an “Exercise” link to the viewer; they have nothing to install.
10Print, export, share
| I want to… | I choose… |
|---|---|
| Print on paper | Print / PDF, then one of the three printing modes: Everything on one page (landscape), Split across pages (with cut marks) or Print shop (high resolution). |
| A sharp, zoomable PDF file | The PDF button: a vector PDF with selectable text. (For non-Latin alphabets, the tool produces an image PDF.) |
| A picture to insert in a document or slides | PNG, or SVG if you want to edit it in a drawing program. |
| Back up or carry my work, pictures included | Import / Export › Export (.json), then Import (.json) on another device. |
| Show my timeline remotely | A link, see below. |
In the browser’s print window, choose “Save as PDF” to get a file, and untick headers and footers for a clean sheet.
The “Import / Export” window
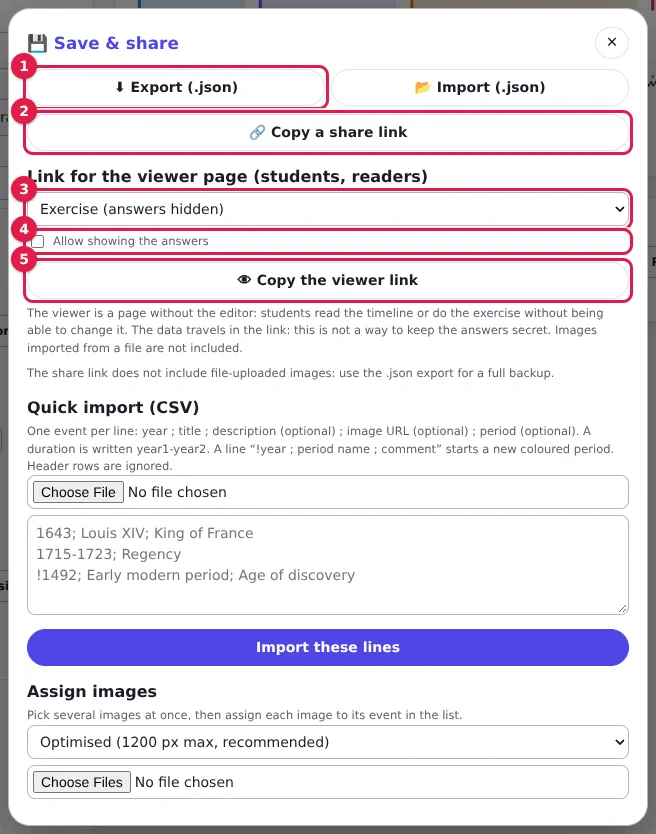
- Export (.json): the full backup of the project. Import (.json) loads it back.
- Copy a share link: a link to the editor, to pass the timeline to a colleague.
- Viewer link type: read-only, exercise (answers hidden) or reading + exercise at the reader’s choice.
- Allow showing the answers: untick it for an exercise that must stay to be completed.
- Copy the viewer link: to send to students or readers.
The viewer, for students and readers
The viewer is a page without an editor: you see the timeline, you can zoom, print or export it, and, depending on the link, read it or practise with the self-assessment.
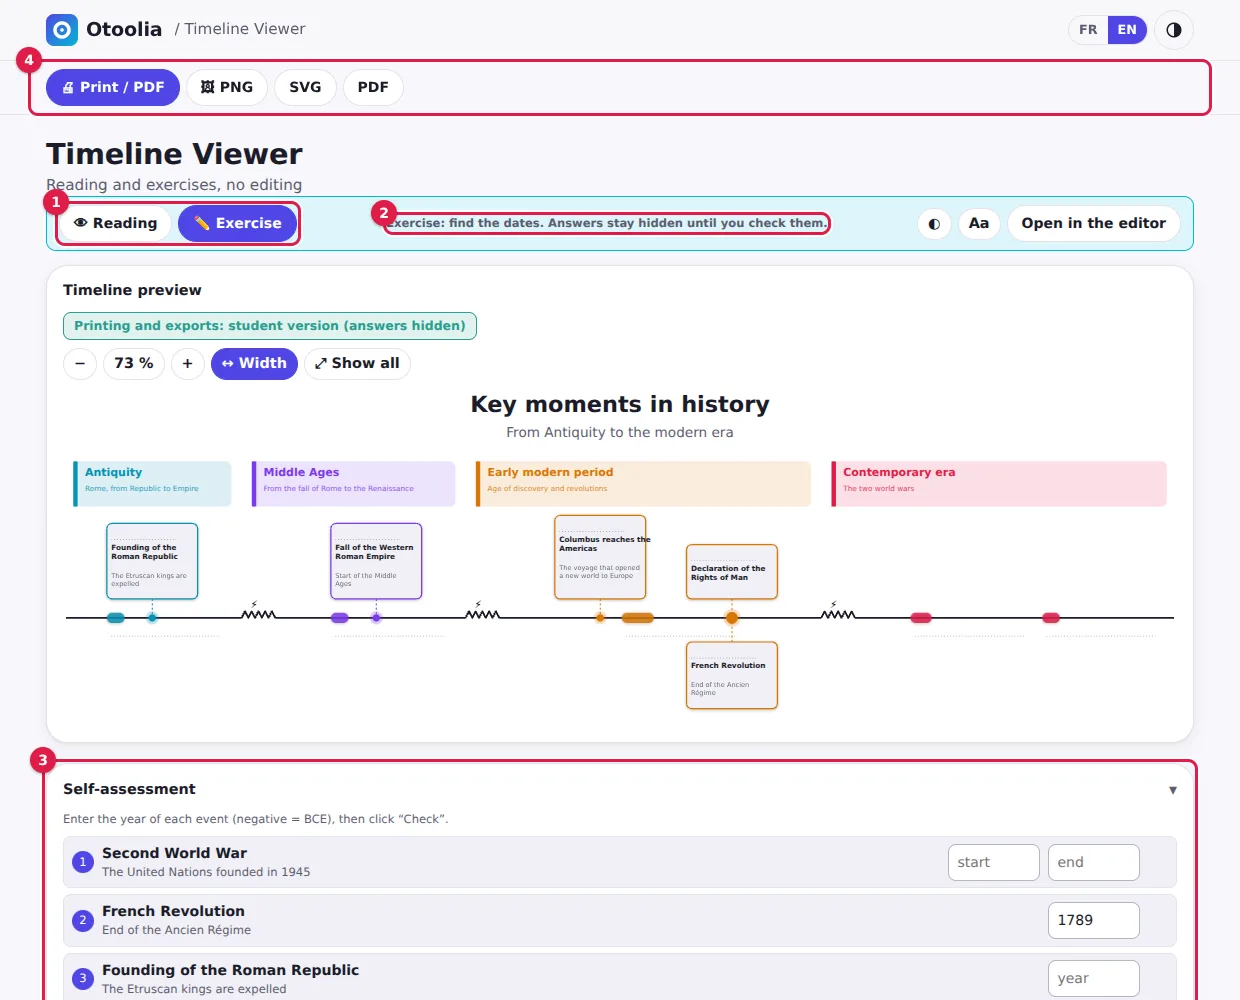
- Reading / Exercise switch (“Reading + exercise” links only).
- Instruction for the current mode.
- Self-assessment: the student types answers and checks them.
- Printing and exports: available to everyone.
Links contain the timeline itself, in the “#” part of the address, which is never sent to our servers. The answers to an exercise therefore travel in the link: hiding the “Show answers” button removes the temptation, but it is not access control.
Careful with the “editor” share link: opening it in the editor loads that timeline in place of the one saved in the browser. Remember to export yours (.json) first. For students, always prefer the viewer link.
11Readability and accessibility
- The Readability sub-menu offers a High contrast mode and a dyslexia-friendly font with airier text. These choices are remembered on the device, and the viewer offers the same buttons (◐ and Aa).
- The button at the top right of the site switches between light and dark themes; the tool, its exports and its printing follow.
- Everything can be operated from the keyboard: cards and sub-menus open with Enter or Space.
12Frequently asked questions
Is my data sent anywhere?
No. The tool runs in your browser: the timeline and its pictures stay on your device. Share links put the timeline in the “#” part of the address, which the browser never sends to a server.
Where do I find my timeline again?
It is saved automatically in the browser of the device you use, with no account. If you clear the browser’s data, it disappears: regularly export a .json file to keep a copy. Only one project is saved at a time; export one before starting another.
My picture added by address does not appear.
Some sites forbid copying their images (and only https:// addresses work). Save the image to your device, then import it as a file.
The PDF does not have the same fonts or characters as the screen.
The PDF button produces a vector PDF for Latin-alphabet texts. For other alphabets, it produces an image PDF, faithful to the screen. The PNG and SVG buttons stay faithful in every case.
Can I stop my students from seeing the answers?
Not completely: an “Exercise” link without the “Show answers” button hides them in the interface, but the data is in the link. For a graded assessment, do not rely on this tool alone.
Which browsers does it work in?
The tool is designed for recent browsers, on computers, tablets and phones. It has been checked in Chrome; if you run into a problem elsewhere, write to us.
✓In short
- Load the example to grasp the idea, or start from an empty timeline.
- Add your events (negative year for BCE), then group them into periods.
- Choose the layout: horizontal or vertical, axis, even or proportional.
- Turn the timeline into an exercise when you want it completed.
- Export a
.jsonto keep a copy, and share the viewer with your students.